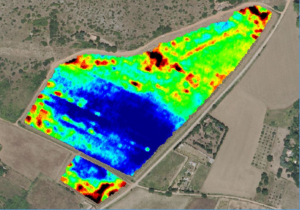
Resistivity maps provide a better understanding of soil characteristics, particularly whether they are well-draining or hydromorphic. They highlight the homogeneity or heterogeneity of soils at both the estate level and within individual plots.
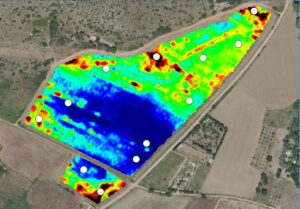
These maps can be especially useful for determining soil sampling points.
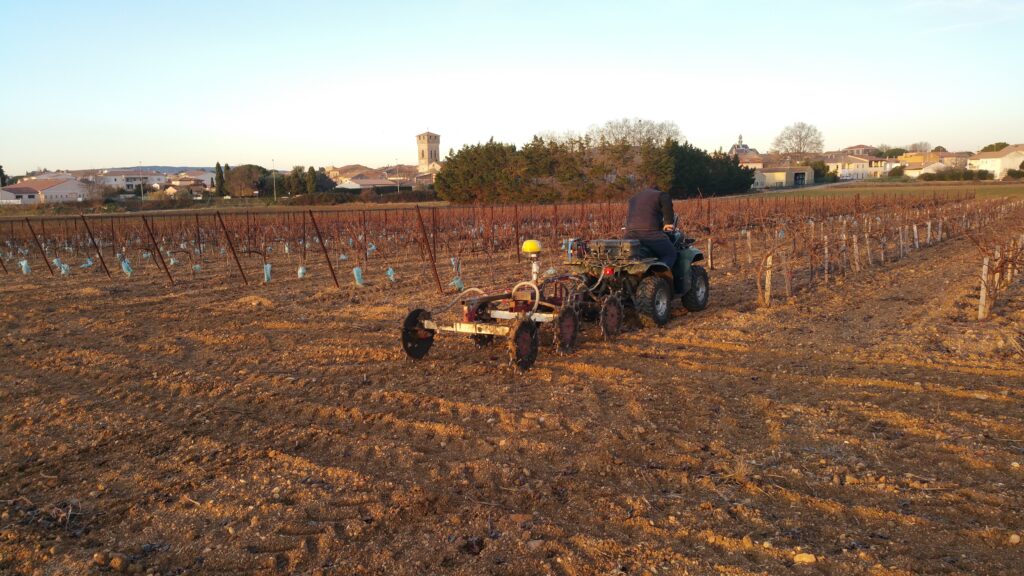
In our case, samples were taken using an auger and analyzed in a laboratory to obtain the sand, silt, and clay fractions required by the Vintel water balance model.
Data
Three types of data are available:
Soil analyses conducted in a laboratory based on soil samples at depths of 25 cm and 75 cm: analysesol_2017.zip (8.9kB)
Interpolated resistivity image data where pixels are not directly linked to resistivity values but are re-associated to highlight differences at the scale of each parcel. Altitude data generated from GPS are also provided: Domaine_du_Chapitre.zip (4.6MB)
Additional data is also available on the other resources page.