
Measuring usable water reserves using resistivity
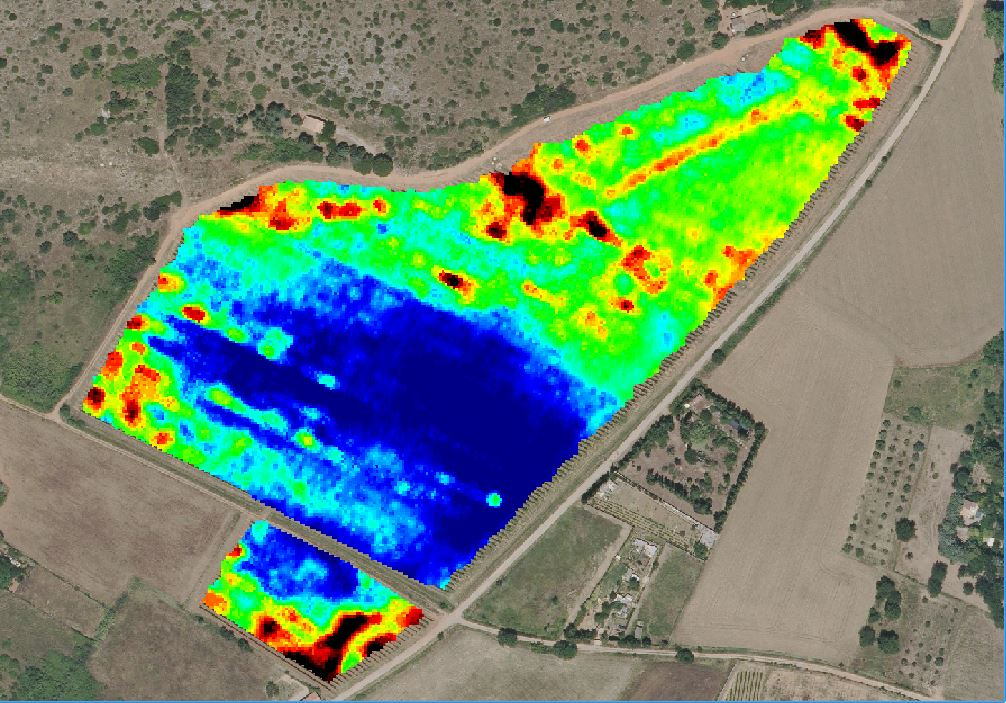
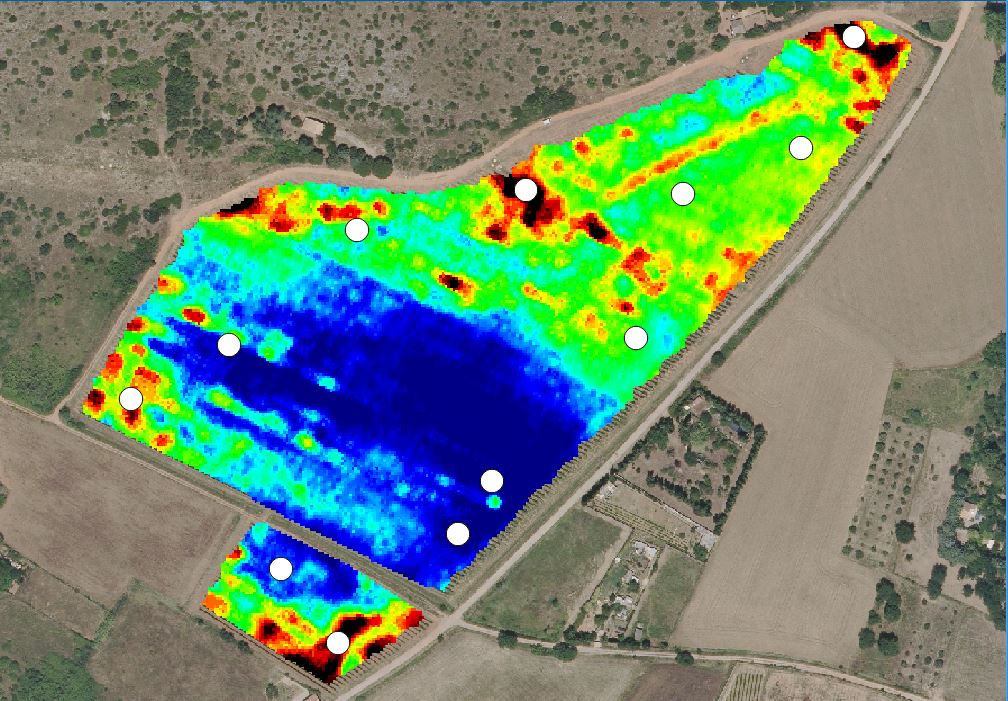
Resistivity maps provide a better understanding of soil characteristics, in particular whether soils are well-drained or hydromorphic. They highlight the homogeneity or heterogeneity of soils across the estate as a whole, as well as within individual plots. These maps can be particularly useful for identifying soil sampling points or for helping to explain, in part, phenomena such as variations in plant vigour, yield, etc.
Available data
Three types of data are available:
- soil analyses carried out in the laboratory based on soil samples taken at depths of 25 and 75 cm: analysesol_2017.zip (8.9 kB)
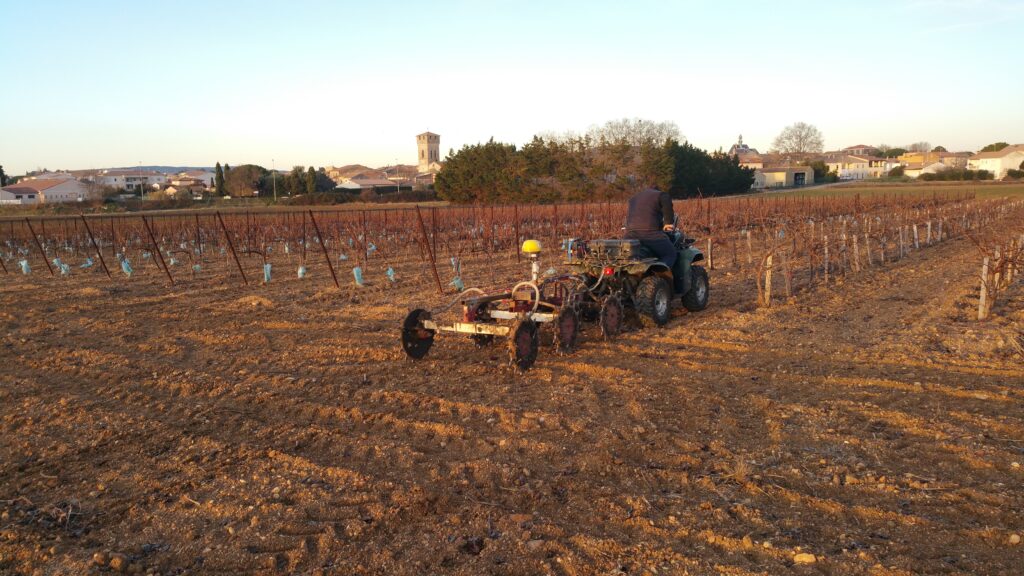
- raw resistivity data at three depths: 0–50 cm, 0–1 m and 0–1.70 m: 2017 Resistivity Map
- interpolated resistivity image data, where the pixels are not directly linked to the resistivity value but are re-associated to highlight differences at the level of each plot. Elevation data derived from GPS is also available: Domaine_du_Chapitre.zip (4.6MB)
Données Disponibles
In the same category
- Deployed Solutions
This sensor measures the volume of GNR in the tank and transmits the data through a LoRa network. Informations can be visualized via an app....
- Deployed Solutions
KYP from Vivelys
KYP Premium, the digital cellar logbook from Vivelys, is dedicated to monitoring winemaking from an operational perspective....

Mas Numérique actions
The project is structured around three complementary modes of action aimed at deploying and testing tools on the estate.